


Research Article - Journal of Environmental and Occupational Health (2022)
Contamination and Health Risk Assessment of Typical Organic Pollutants in the Huaihe River Basin’s Primary Source Water
Jijun Gao*, Linghua Liu, Xiaoru Liu, Qiwen Wang, Laisheng Liu and Tianying LaoJijun Gao, Department of Water Ecology and Environment, China Institute of Water Resources and Hydro-Power Research, Beijing, China, Email: gaojj@iwhr.com
Received: 17-Jun-2022, Manuscript No. JENVOH-22-66844; Editor assigned: 20-Jun-2022, Pre QC No. JENVOH-22-66844 (PQ); Reviewed: 05-Jul-2022, QC No. JENVOH-22-66844; Revised: 12-Jul-2022, Manuscript No. JENVOH-22-66844 (R); Published: 20-Jul-2022
Abstract
Samples were taken from fifty-one surface source water stations (including reservoirs, rivers, and lakes) in the Huaihe River basin to determine the typical organic pollutant contamination status of the major source water. The samples were tested for 17 different organic contaminants, including benzene homology, chlorobenzene compounds, organophosphorous insecticides, and nitrogenbenzene compounds. The amounts of the 17 chemicals in the fifty-one source water samples were all fewer than the Chinese surface water quality standard’s standard limit levels. The results of the target chemical detection rate revealed that typical organic contaminants have been prevalent in the Huaihe River basin’s source water. The noncarcinogenic risk HQ values of the target compounds were less than one, and the cancer risk values of most source water sites were much lower than the 1 × 10⁻⁶; only the cancer risk values of sites 4, 13, 19, 23, 38, and 40 were higher than the 1 × 10⁻⁶, indicating that the health risk posed by the target compounds in the majority of source water sites was within acceptable limits.
Keywords
Huaihe River basin; source water; Benzene; Chlorobenzene; Organophosphorous pesticides; Nitrobenzene
Introduction
The Huaihe River basin is one of China’s seven major basins, covering 274657 km2 and running through four provinces from Henan to Jiangsu before entering the Yangtze River. Water pollution and scarcity have become a massive impediment to the long-term development of the social economy in this area as a result of the rapid growth of the economy and the proliferation of metropolitan populations [1]. Organic pollutants have long been a source of worry due to their widespread production and use, as well as their harmful effects on non-target organisms, ubiquity, bioaccumulation, and environmental persistence. The most widely utilized chemicals in China were Organo Phosphorous Pesticides (OPPs), nitrobenzene compounds, chlorobenzene compounds, and benzene homology, which resulted in widespread contamination in many environmental compartments [2-8]. Chemicals can enter the aquatic environment in a variety of ways, including effluent discharge, agricultural runoff, atmospheric deposition, and other routes. Organic pollutants have become a research topic for international environment scientists due to their threat to the environment and human health. The Huaihe River basin was the most contaminated of China’s seven major basins [4,5] and organic pollutants that may reach the Huaihe River basin’s source water could influence the drinking water safety of Huaihe River basin residents. Because of their hazard to the environment and human health, organic contaminants have become a research issue for international environmental scientists.
According to the Chinese surface water quality standard, samples collected from fifty-one source waters of the Huaihe River basin were analyzed for benzene homology, chlorobenzene compounds, nitrobenzene compounds, Organo Phosphorous Pesticides (OPPs), and detailed sample source water information and composition (Table 1) to understand the contamination status and potential affection to drinking water safety of the representative organic pollutants in the main source water of the Huaihe River basin.
| Number | Source water name | Number | Source water name |
|---|---|---|---|
| 1 | Mailing Reservoir | 27 | Haizhou Source Water |
| 2 | Zhoukouzha | 28 | Suzhou Sanshisansushe |
| 3 | Zhumadian Reservoir | 29 | Huaibei Bengfang |
| 4 | Baiguishan Reservoir | 30 | Xuyishuiwenzhan |
| 5 | Xiliuhu | 31 | Gaoliangjianzha |
| 6 | Shimantan Reservoir | 32 | Jinhu Lake |
| 7 | Shihenanwan | 33 | Erhezha |
| 8 | Menlou Reservoir | 34 | Yundongzha |
| 9 | Dongfeng Reservoir | 35 | Huaiyin |
| 10 | Linshui Reservoir | 36 | Jinzhen |
| 11 | Xiaobudongba | 37 | Yanghetanzha |
| 12 | Jiningzhongshui | 38 | Shilianghe Reservoir |
| 13 | Chanzhi Reservoir | 39 | Sanlizha |
| 14 | Weishanhu Lake | 40 | Xingouqiao |
| 15 | Mishan Reservoir | 41 | Dongxinqiao |
| 16 | Dongjiao Reservoir | 42 | Jiahezha |
| 17 | Nanyang | 43 | Linjiaba |
| 18 | Yicheng | 44 | Liushanzha |
| 19 | Jimoyifengdian | 45 | Zaohezha |
| 20 | Xiashan Reservoir | 46 | Jiulishan |
| 21 | Andi Reservoir | 47 | Qiligou |
| 22 | Hainangongluqiao | 48 | Dinglou |
| 23 | Bengbuzhashang | 49 | Funing |
| 24 | Liuanzongganquwulidun | 50 | Sheyang |
| 25 | Chahuazhan | 51 | Gaoyou Lake |
| 26 | Fuyan Source Water |
Materials and Methods
Pretreatment of samples and sampling
The Global Positioning System (GPS) was used to determine the sampling positions, and the sites map distribution is given in Figure 1. Samples were collected from fifty-one source water points, and the Global Positioning System (GPS) was used to locate the sampling positions.

Figure 1. The sample point distribution map.
In 2015, samples for benzene homology and chlorobenzene compounds analysis were taken, and they were placed in amber glass sampling vials that had been chemically cleansed prior to collecting the water samples. Fill sample vials to the brim; no air bubbles should travel through the sample while filling or become caught in the sample after sealing. Water samples should be taken 0.5 meters below the surface, at the Centre of the source water sites. After collection, all samples should be refrigerated and delivered to the laboratory, where they should be kept at 4°C for 7 days. All of the samples were taken in pairs.
In 2015, samples for the examination of nitrobenzene compounds and OPPs were collected in glass sampling vials, which should be chemically cleaned before collecting water samples, refrigerated, and delivered to the laboratory. Water samples from 0.5 m below the surface should be taken. Three samples were taken and combined in the middle of the source water point, from left to right; all samples must be extracted in the field immediately and analyzed within two weeks. Surrogate standards (1,3-dimethyl-2-nitrobenzene, perylene-D12) were added after aliquots of the sample (5.01) were filtered through a 0.45 μm glass fiber membrane under vacuum [9]. Solid Phase Extraction (SPE) was used to extract water samples according to published techniques [10-12]. Briefly, the SPE cartridges were first conditioned with 2 × 5 ml of methanol followed by 2 × 5 ml of deionized water, Water samples were passed through the cartridges at a flow rate of 6 ml/min under vacuum. The target compounds were eluted with 8 ml of methylene chloride, which was also used to rinse the inside of each sample bottle, followed by 5 ml methylene chloride rinse of the surfaces. Anhydrous Na2SO4 was used to eliminate any remaining water, and the volume was decreased to 0.5 ml by evaporation under nitrogen gas before adding the internal standards (acenaphthene- D10, phenanthrene-D10, and chrysene-D12).
Chemical analysis
Analysis of benzene homology and chlorobenzene compounds: HPLC grade solvents were employed for sample processing and analysis. A Milli-Q system was used to make deionized water (Millipore, Watford). Supelco provided chemical standards for all of the substances. Warm the sample to room temperature, and then carefully pour it into one of the syringe barrels until it slightly overflows. Invert the syringe and compress the sample after replacing the syringe plunger. Adjust the sample volume to 25.0 mL by opening the syringe valve and venting any residual air. Add internal standard (fluorobenzene) and surrogates (1,2-dichlorobenzene-d4, BFB) to all samples, blanks, and calibration standards through the syringe valve, then close the valve. Connect the sample syringe valve to the purging device’s syringe valve. Open the sample syringe valve and inject the sample into the purging chamber after the trap has reached a temperature of less than 25°C. Purge the system by closing both valves. Purge the sample at room temperature for 11.0 minutes. Standards and samples must be analyzed in the same way, and the room temperature must be kept relatively constant.
For benzene homology and chlorobenzene compound analysis, an Agilent 6890 GC was employed in conjunction with a model 5973N MS detector in chosen ion mode. HP-5MS capillary columns were used (60 m × 0.25 mm i.d. × 0.10 μm film thickness). For MS, the carrier gas was helium. The inlet was heated to 180°C. The GC column temperature was programmed as follows: initially at 40°C (equilibrium time 4 min), increased to 250°C at the rate of 6°C min-1 and held for 5 min. The MS temperature was set at 280°C and the electron impact energy was 70 eV.
Analyses of nitrobenzene compounds and OPPs: All of the solvents utilized for sample processing and analysis were HPLC grade (dichloromethane, ethyl acetate, acetone, and methanol). A Milli-Q system was used to make deionized water (Millipore, Watford). Supelco provided chemical standards for all of the substances. Internal standards (acenaphthene-D10, phenanthrene-D10, and chrysene-D12) and surrogates (1,3-dimethyl-2-nitrobenzene, perylene-D12) were added to each working standard, which were produced in methylene chloride. To make calibration solutions, these solutions were diluted further using methylene chloride.
The nitrobenzene compounds and OPPs were analyzed using an Agilent 6890 GC connected to a model 5973N MS detector in chosen ion mode. HP-5MS capillary columns were used (30 m × 0.25 mm i.d. × 0.25 μm film thickness). For MS, the carrier gas was helium. The intake was heated to 200oC. The GC column temperature was programmed as follows: initially at 60oC (equilibrium time 1 min), increased to 140oC at the rate of 10oC min-1 then to 230oC at 5oC min-1 before reaching 260oC at 10oC min-1 and held for 5 min. The electron impact energy was 70eV and the MS temperature was adjusted to 280oC.
Risk analysis
The Lifetime Average Daily Dose (LADD) is a metric suggested by the US EPA [13] for estimating an individual’s daily exposure. The following equation, adapted from the US EPA [14] and Chrostowski [15], provides a similar representation of daily exposure for ingestion route:
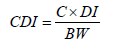
Where CDI is for chronic exposure dosage in milligrams per kilogram per day, DI stands for average daily intake rate of drinking water (2.2 liters per day), C stands for drinking water contaminant concentration in milligrams per liter, and BW stands for average body weight (70 kg). The subject’s chronic daily exposure level was estimated using the values of these three input variables, which were unique to each participant. Individual exposures were estimated using Eq.(1) in deterministic exposure assessment. The following equation [13,15] is used to assess the lifetime cancer risk linked with ingesting exposures:
R = CDI × SF (2)
Where R was the cancer slope factor of the chemical (mg/ kg.d) and SF was the chance of excess lifetime cancer. The Hazard Quotient (HQ) was estimated using the following equation [16] to determine noncarcinogenic risk:

The reference dose (mg/kg.d) is RfD. The SF and RfD values used in this investigation were from the USEPA [17]. Table 2 displays the RfD and SF values of the target compounds.
| Compounds | Reference Dose (RfD) (mg/kg.day) |
Slope Factor (SF) (mg/kg.day) |
|---|---|---|
| Benzene homology | ||
| Benzene | 4 × 10⁻³ | 5.5 × 10⁻² |
| Toluene | 8 × 10⁻² | -- |
| Ethylbenzene | 1 × 10⁻¹ | -- |
| Isopropylbenzene | -- | -- |
| Chlorobenzene compounds | ||
| 1,4-Dichlorobenzene | -- | -- |
| 1,2-Dichlorobenzene | 9 × 10⁻² | -- |
| Chlorobenzene | 2 × 10⁻² | -- |
| Organophosphorous | ||
| Pesticides | ||
| Dichlorvos | 5 × 10⁻⁴ | 2.9 × 10⁻¹ |
| Demeton | 4 × 10⁻⁵ | -- |
| Dimethoate | 2 × 10⁻⁴ | -- |
| Methyl Parathion | 2.5 × 10⁻⁴ | -- |
| Malathion | 2 × 10⁻² | -- |
| Parathion | -- | -- |
| Nitrobenzene compounds | ||
| Nitrobenzene | 2 × 10⁻³ | -- |
| p-Nitrochlorobenzene | -- | -- |
| 2,4-Dinitrotoluene | 2 × 10⁻³ | -- |
| 2,4-Dinitrochlorobenzene | -- | -- |
QA/QC procedures
The internal standard approach employing peak area was used to quantify the residue levels of the target chemicals. The target compounds’ Method Detection Limits (MDLs) were set at 3:1 signal to noise value (S/N). A procedural blank and a spiked sample with standards were run for each set of ten samples to check for interference and cross-contamination. The recoveries, Method Detection Limits (MDLs), and Relative Standard Derivation (RSD %) of the technique are shown in Table 3. The analytical procedures’ appropriateness was confirmed by these metrics.
|
Compounds |
Mean accuracy (%) |
MDLs (ng/l) |
RSD (%) |
|---|---|---|---|
|
Benzene |
79 | 10.6 | 4.2 |
|
Toluene |
82 | 12.5 | 6.2 |
|
Ethyl Benzene |
89 | 14.3 | 7.2 |
|
Isopropylbenzene |
92 | 8.5 | 8.6 |
|
1,4-Dichlorobenzene |
107 | 22.7 | 14.9 |
|
1,2-Dichlorobenzene |
110 | 20.4 | 15.6 |
|
Chlorobenzene |
89 | 12.8 | 8.2 |
|
Nitrobenzene |
101 | 6.2 | 2.4 |
|
p-Nitrochlorobenzene |
83 | 10.5 | 3.4 |
|
2,4-Dinitrotoluene |
86 | 10.8 | 4.2 |
|
2,4-Dinitrochlorobenzene |
88 | 14.2 | 6.9 |
|
Dichlorvos |
72 | 1.4 | 7.2 |
|
Demeton |
76 | 1.5 | 6.3 |
|
Dimethoate |
83 | 1.3 | 2.5 |
|
Methyl parathion |
81 | 0.9 | 6.3 |
|
Malathion |
79 | 0.8 | 4.2 |
|
Parathion |
84 | 0.9 | 5.9 |
Statistical analysis
Prior to statistical analysis, values for all target compounds lower than MDL were replaced with zero. The software Excel was utilized in this study.
Results
The findings of the benzene homology and chlorobenzene compounds concentrations
Table 4 summarizes the concentrations of benzene, toluene, ethylbenzene, and isopropylbenzene. The four chemicals were detected in 80.4%, 94.1%, 82.4% and 74.5% of all samples, respectively. The benzene concentrations varied from <10.6 to 21330.0 ng 1-1, with a mean of 2526.1 ng 1-1 and a 90% percentile of 10724.0 ng 1-1 (Table 4).Toluene concentrations ranged from <12.5 to 25520.0 ng 1-1, with a mean value of 735.7 ng 1-1 and a 90% percentile value of 538.0 ng 1-1 (Table 4); ethyl benzene concentrations ranged from <14.3 to 1300.0 ng 1-1, with a mean value of 374.7 ng 1-1 and a 90% percentile value of 950.0 ng 1-1 (Table 4). Isopropylbenzene concentrations ranged from <8.5 to 360.0 ng 1-1, with a mean of 41.0 ng 1-1 and a 90% percentile of 137.0 ng 1-1 (Table 4).
| Compound name | Standard limit of China | Detection rate% | Minimum value | Mean Value |
90th Percentile |
Maximum Value |
| Benzene | 1 × 10⁴ | 80.4 | <10.6 | 2526.1 | 10724.0 | 21330.0 |
| Toluene | 7 × 10⁵ | 94.1 | <12.5 | 735.7 | 538.0 | 25520.0 |
| Ethyl Benzene | 3 × 10⁵ | 82.4 | <14.3 | 374.7 | 950.0 | 1300.0 |
| Isopropylbenzene | 2.5 × 10⁵ | 74.5 | <8.5 | 41.0 | 137.0 | 360.0 |
| 1,4-Dichlorobenzene | 3 × 10⁵ | 56.9 | <22.7 | 328.6 | 749.0 | 7430.0 |
| 1,2-Dichlorobenzene | 1 × 10⁶ | 49.0 | <20.4 | 335.5 | 224.0 | 8640.0 |
| Chlorobenzene | 3 × 10⁵ | 64.7 | <12.8 | 948.2 | 4096.0 | 7830.0 |
| Nitrobenzene | 1.7 × 10⁴ | 72.5 | <6.2 | 24.8 | 68.2 | 80.0 |
| p-Nitrochlorobenzene | 5 × 10⁴ | 78.4 | <10.5 | 35.8 | 50.0 | 372.0 |
| 2,4-Dinitrotoluene | 3 × 10² | 78.4 | <10.8 | 30.5 | 38.0 | 350.0 |
| 2,4-Dinitrochlorobenzene | 5 × 10⁵ | 86.3 | <14.2 | 45.1 | 61.4 | 434.0 |
| Dichlorvos | 5 × 10⁴ | 100 | 2.0 | 22.6 | 62.6 | 140.0 |
| Demeton | 3 × 10⁴ | 92.2 | <1.5 | 39.3 | 90.0 | 200.0 |
| Dimethoate | 8 × 10⁴ | 51.0 | <1.3 | 27.0 | 80.0 | 280.0 |
| Methyl Parathion | 2 × 10³ | 41.2 | <0.9 | 12.8 | 40.0 | 60.0 |
| Malathion | 5 × 10⁴ | 51.0 | <0.8 | 31.5 | 81.0 | 229.0 |
| Parathion | 3 × 10³ | 41.2 | <0.9 | 7.3 | 20.0 | 30.0 |
The results of the nitrobenzene compounds and organophosphorous insecticides concentrations
Table 4 summarizes the statistical data for nitrobenzene compounds and organophophorous pesticide concentrations. For all the samples, the detection rates of the nitrobenzene, p-nitrochlorobenzene, 2,4-dinitrotoluene and 2,4-dinitrochlorobenzene were 72.5%, 78.4%, 78.4% and 86.3%, respectively. The four nitrobenzene compounds had equal detection rates. In addition, it was also known that the mean values of the nitrobenzene, p-nitrochlorobenzene, 2,4-dinitrotoluene and 2,4-dinitrochlorobenzene were 24.8 ng 1-1, 35.8 ng 1-1, 30.5 ng 1-1 and 45.1 ng 1-1, ranged from <6.2 to 80.0 ng 1-1, <10.5 to 372.0 ng 1-1, <10.8 to 350.0 ng 1-1 and <14.2 to 434.0 ng 1-1, respectively.
The detection rates of dichlorvos, demeton, dimethoate, methyl parathion, malathion, and parathion were 100%, 92.2%, 51.0%, 41.2%, 51.0%, and 41.2%, respectively, as shown in Table 4. Dichlorvos and demeton had substantially greater detection rates than the other six organophosphorous pesticides, indicating that dichlorvos and demeton were widely present in the Huaihe River basin. Dichlorvos concentrations varied from 2.0 ng 1-1 to 140 ng 1-1, with a mean of 22.6 ng 1-1 and a 90% percentile of 62.6 ng 1-1 (Table 4); demeton concentrations ranged from <1.5 ng 1-1 to 200.0 ng 1-1, with a mean of 39.3 ng 1-1 and a 90% percentile of 90 ng 1-1 (Table 4). Dimethoate concentrations ranged from <1.3 ng 1-1 to 280 ng 1-1, with a mean of 27 ng 1-1 and a 90% percentile of 80.0 ng 1-1 (Table 4). The concentrations of methyl parathion, malathion, and parathion ranged from <0.9 ng 1-1 to 60 ng 1-1, <0.8 ng 1-1 to 229 ng 1-1 and <0.9 ng 1-1 to 30 ng 1-1, respectively with mean values of 12.8 ng 1-1, 31.5 ng 1-1 and 7.3 ng 1-1, respectively, with the 90% percentile values of 40.0 ng 1-1, 81.0 ng 1-1 and 20.0 ng 1-1.
The findings of the health risk assessment
Because the RfD for isopropylbenzene and 1,4-dichlorobenzene were not available for this investigation, the noncarcinogenic risk of these chemicals could not be determined. Table 5 lists the HQ values for the other target chemicals. Table 5 shows that the computed HQ values indicated insignificant noncarcinogenic hazards, even though the maximum total HQ value for source water site 4 was nearly four times less than one. The cancer risks of benzene and dichlorvos could be computed, but the cancer risks of the other chemicals could not be calculated since their SFs were not accessible. The SF of benzene was given a range and the highest limit of the range was employed in calculations.
| Source water Number |
Benzene homology HQ | Chlorobenzenes compounds HQ |
OPPs HQ | Nitrobenzene compounds HQ | Total HQ |
|---|---|---|---|---|---|
| 1 | 0.3 | 0 | 0.6 | 67.3 | 68.3 |
| 2 | 0.5 | 0 | 0.8 | 75.2 | 76.5 |
| 3 | 11.6 | 0 | 0.9 | 174.5 | 187.1 |
| 4 | 159 | 1 | 1.6 | 51 | 212.5 |
| 5 | 0.5 | 0 | 1.6 | 69.8 | 71.8 |
| 6 | 0.9 | 0 | 0.6 | 58.9 | 60.4 |
| 7 | 0.3 | 0 | 1.4 | 69.2 | 70.9 |
| 8 | 0.4 | 0 | 0.9 | 89.9 | 91.2 |
| 9 | 3.4 | 0 | 1.3 | 51 | 55.6 |
| 10 | 3 | 0 | 0.3 | 41.2 | 44.5 |
| 11 | 0.2 | 0 | 0.5 | 55.2 | 55.8 |
| 12 | 0.3 | 0 | 0.2 | 25.5 | 25.9 |
| 13 | 10.3 | 0 | 0.9 | 62 | 73.3 |
| 14 | 0.6 | 0 | 0.5 | 93.7 | 94.8 |
| 15 | 0.8 | 0 | 0.5 | 59.5 | 60.8 |
| 16 | 0.3 | 0 | 1.9 | 119.4 | 121.6 |
| 17 | 0.3 | 0 | 1.6 | 195 | 196.9 |
| 18 | 0.8 | 0.1 | 0.9 | 43.1 | 44.9 |
| 19 | 21.9 | 0 | 1.6 | 172 | 195.5 |
| 20 | 3.3 | 0 | 0.5 | 38.7 | 42.5 |
| 21 | 0.9 | 0.1 | 0.5 | 35.2 | 36.7 |
| 22 | 2.6 | 12.3 | 0.3 | 2.3 | 17.6 |
| 23 | 13.9 | 5.6 | 0.3 | 4 | 23.8 |
| 24 | 1.6 | 0.2 | 1 | 0.8 | 3.6 |
| 25 | 4.4 | 0.2 | 0.4 | 14.6 | 19.7 |
| 26 | 4.6 | 0.2 | 0.3 | 2.3 | 7.4 |
| 27 | 7 | 0.2 | 1.7 | 17 | 25.9 |
| 28 | 3.3 | 0.1 | 0.3 | 3.4 | 7.2 |
| 29 | 4.4 | 0.2 | 0.3 | 3.7 | 8.6 |
| 30 | 7.7 | 0.6 | 1 | 2.4 | 11.7 |
| 31 | 7.2 | 1.7 | 0.5 | 5 | 14.3 |
| 32 | 4.3 | 1 | 0.7 | 33.4 | 39.4 |
| 33 | 3.9 | 1.2 | 6.5 | 35.4 | 47 |
| 34 | 8.1 | 1.2 | 0.7 | 6.7 | 16.7 |
| 35 | 11.1 | 0.2 | 0.5 | 3.5 | 15.3 |
| 36 | 2.6 | 0.6 | 0.8 | 9.1 | 13.2 |
| 37 | 4.3 | 0.7 | 0.5 | 2.2 | 7.8 |
| 38 | 21.3 | 0.3 | 0.9 | 10.2 | 32.7 |
| 39 | 5.6 | 0 | 0.5 | 3 | 9.1 |
| 40 | 38.4 | 0.4 | 0.3 | 1.3 | 40.4 |
| 41 | 10.3 | 0.3 | 1.3 | 2.1 | 14.1 |
| 42 | 9 | 7.5 | 0.7 | 3.6 | 20.8 |
| 43 | 177.3 | 6.9 | 0.5 | 8.2 | 193 |
| 44 | 159.4 | 6.6 | 0.7 | 12.2 | 178.8 |
| 45 | 143.9 | 6.5 | 0.6 | 3 | 154 |
| 46 | 5.2 | 6.2 | 0.4 | 4.8 | 16.6 |
| 47 | 119.9 | 5.6 | 0.4 | 2.4 | 128.3 |
| 48 | 163.7 | 7.5 | 0.7 | 0.6 | 172.5 |
| 49 | 16.6 | 0.2 | 1 | 36.5 | 54.3 |
| 50 | 16.7 | 0.2 | 0.6 | 49.5 | 67 |
| 51 | 19.8 | 0.2 | 0.5 | 16.1 | 36.6 |
The figures of carcinogenic risk were reported in Table 6. According to Table 6, the cancer risk values of benzene and dichlorvos in most source water sites were all less than 1 × 10⁻⁶, with the exception of the sites 4, 13, 19, 23, 38, and 40, where the cancer risk values were 3.4 × 10⁻⁶, 2.7 × 10⁻⁶, 2.4 × 10⁻⁶, 2.4 × 10⁻⁶, and 1.8 × 10⁻⁶, respectively. The maximum total cancer risk value (3.5 × 10⁻⁵) occurred in the source water point 4, followed by the 40, 23, 13, 19, 38, where the cancer risk values were 3.4 × 10⁻⁶, 2.7 × 10⁻⁶, 2.4 × 10⁻⁶, 2.4 × 10⁻⁶ and 1.8 × 10⁻⁶, respectively. As a result, the cancer risks posed by benzene and dichlorvos at sites 4, 13, 19, 23, 38, and 40 were at an unacceptable level, and more attention should be paid to them.
| Source water Number |
Benzene cancer risk level | Dichlorvos cancer risk level | Total cancer risk level |
|---|---|---|---|
| 1 | 0.1 | 0 | 0.1 |
| 2 | 0.1 | 0 | 0.1 |
| 3 | 0.2 | 0.1 | 0.3 |
| 4 | 35 | 0.1 | 35 |
| 5 | 0.1 | 0 | 0.1 |
| 6 | 0.1 | 0 | 0.2 |
| 7 | 0 | 0 | 0.1 |
| 8 | 0.1 | 0 | 0.1 |
| 9 | 0.1 | 0 | 0.1 |
| 10 | 0.1 | 0 | 0.1 |
| 11 | 0 | 0.1 | 0.1 |
| 12 | 0 | 0 | 0 |
| 13 | 1.7 | 0 | 1.8 |
| 14 | 0.1 | 0 | 0.1 |
| 15 | 0 | 0 | 0.1 |
| 16 | 0.1 | 0 | 0.1 |
| 17 | 0 | 0.1 | 0.1 |
| 18 | 0.1 | 0 | 0.1 |
| 19 | 2.4 | 0.1 | 2.4 |
| 20 | 0.7 | 0 | 0.7 |
| 21 | 0.1 | 0 | 0.1 |
| 22 | 0.1 | 0 | 0.1 |
| 23 | 2.7 | 0 | 2.7 |
| 24 | 0.1 | 0 | 0.1 |
| 25 | 0.4 | 0 | 0.4 |
| 26 | 0.4 | 0 | 0.4 |
| 27 | 0.5 | 0 | 0.5 |
| 28 | 0.3 | 0 | 0.3 |
| 29 | 0.6 | 0 | 0.6 |
| 30 | 0.6 | 0 | 0.6 |
| 31 | 0 | 0 | 0 |
| 32 | 0 | 0 | 0 |
| 33 | 0 | 0.1 | 0.1 |
| 34 | 0.7 | 0 | 0.7 |
| 35 | 0 | 0 | 0 |
| 36 | 0 | 0 | 0 |
| 37 | 0 | 0 | 0 |
| 38 | 2.4 | 0 | 2.4 |
| 39 | 0 | 0 | 0 |
| 40 | 3.4 | 0 | 3.4 |
| 41 | 0 | 0 | 0 |
| 42 | 0 | 0 | 0 |
| 43 | 36.9 | 0 | 36.9 |
| 44 | 33.8 | 0 | 33.9 |
| 45 | 30.2 | 0 | 30.2 |
| 46 | 0 | 0 | 0 |
| 47 | 25 | 0 | 25 |
| 48 | 35.2 | 0 | 35.2 |
| 49 | 2.8 | 0 | 2.8 |
| 50 | 2.7 | 0 | 2.8 |
| 51 | 2.9 | 0 | 2.9 |
Discussion
Analysis of the benzene homology and chlorobenzene compounds’ concentration distribution characteristics
According to the statistical results, benzene and toluene had much higher mean values and detection rates than ethylbenzene and isopropylbenzene, implying that benzene and toluene were the main pollutants and that the main source water sites in the Huaihe River basin were contaminated to some extent by the two compounds. Table 4 summarizes the concentrations of 1,4-dichlorobenzene, 1,2-dichlorobenzene, and chlorobenzene. Table 4 shows that the detection rates for 1,4-dichlorobenzene, 1,2-dichlorobenzene, and chlorobenzene were 56.9%, 49.0%, and 64.7%, respectively. The mean concentrations and detection rates of 1,4-dichlorobenzene, 1,2-dichlorobenzene, and chlorobenzene were 328.6, 335.5, and 948.2 ng 1-1, respectively, implying that cholrobenzene was the predominant contaminant among the three chlorobenzene components in the Huaihe River basin source water.
Analysis of the nitrobenzene compounds and organophosphorous pesticides’ concentration distribution characteristics
According to the statistical results for nitrobenzene compound concentrations, it should be concluded that the concentrations of nitrobenzene, p-nitrochlorobenzene, and 2,4-dinitrochlorobenzene were identical, and the nitrobenzene compounds had similar contamination status. Although the four nitrobenzene compounds had high detection rates of more than 70%, the mean values of the four nitrobenzene compounds were not high, implying that the nitrobenzene compounds were not the main pollutants and that the Huaihe River basin’s source water was not contaminated to some extent.
According to the statistical data, demeton (39.3 ng 1-1) > malathion (31.5 ng 1-1) > dimethoate (27 ng 1-1) > dichlorvos (22.6 ng 1-1) > methyl parathion (12.8 ng 1-1) > parathion (7.3 ng 1-1) were the mean values of the six organophosphorous pesticides ranked from high to low. The dichlorvos and demeton had substantially higher detection rates and mean levels, implying that the two organophosphorous pesticides were the primary pollutants in the Huaihe River basin’s main source water.
The distribution of target chemicals in space
Figures 2 and 3 depict the spatial distributions of benzene homology and chlorobenzene complexes. According to Figure 2, benzene and toluene were the most common benzene homolgy pollutants and were found in all fifty- one source water sites, while ethylbenzene and isopropylbenzene concentrations were substantially lower than those of benzene and toluene. Furthermore, the source water point 40 had the greatest total benzene homology concentration, followed by the 43, 48, 4, 44, and 45. The six source water locations’ total concentrations were all substantially greater than 18000 ng 1-1. The other source water points had lower benzene homology total concentrations than the six source water points above. Except for point 4, the remaining high concentration locations (40, 43, 44, 45, 47, 48) were found in Jiangsu province’s source water points, according to the geographical analysis results. The cholrobenzene compounds were the predominant pollutants in the fifty-one source water locations. Furthermore, the source water point 22 had the greatest total cholrobenzene compound concentration, followed by the 23, 42, 48, 45, and 43. The six source water locations’ total values were all substantially greater than 4100 ng 1-1. The high sum concentration sites of chlorobenzene compounds (42, 43, 44, 45, 46, 47, 48) were mostly found in Jiangsu province’s source water points, according to Figure 3. Above all, it was discovered that benzene homology and chlorobenzene compounds contamination occurred primarily in Jiangsu province’s source water locations.

Figure 2. Spatial distribution of benzene homology in the typical source water of Huaihe River.
Note: ( ) Benzene, (
 ) Toluene, (
  ) Ethylbenzene, (
 ) Isopropylbenzene
Figure 3. Spatial distribution of chlorobenzene compounds in the typical source water of Huaihe River.
Note: ( ) 1,4-Dichlorobenzene, (
 ) 1,2-Dichlorobenzene, (
 ) chlorobenzene
 The regional distribution of nitrobenzene compounds and organophosphorous pesticides was observed in Figures 4 and 5. The nitrobenzene compounds were found mostly in source water sites 33, 30, and 32, with the sum concentration (1059 ng 1-1) of nitrobenzene compounds for source water point 33 being the highest, followed by 30 and 32. The source water point 28 had the lowest concentration (24 ng 1-1). The high sum concentration points of nitrobenzene compounds (33, 30, 32) were mostly found in Jiangsu province’s source water points, according to Figure 4.

Figure 4. Spatial distribution of nitrobenzene compounds in the typical source water of Huaihe River.
Note: ( ) Nitrobenzene, (
 ) P-nitrobenzene, (
 ) 2,4-Dinitrotoluene, (
  ) 2,4-Dinitrochlorobenzene
Figure 5. Spatial distribution of OPPs in the typical source water of Huaihe River.
Note: ( ) Dichlorvos, (
  ) Demeton, (
 ) Dimethoate, (
  ) Methyl parathion, (
 ) Malathion, (
 ) Parathion
 The sum concentrations of the sites (3, 16, 17) were much higher than the sum concentrations of the other sites, as shown in Figure 5. Organophosphorous pesticides were mostly found in the source water points from 1 to 21, with the sum concentrations of the sites (3, 16, 17) being much higher than the sum concentrations of the other sites. The cumulative concentration of organophosphorous pesticides (8 ng 1-1) in source water point 28 was the lowest of the fifty-one source water sites. Furthermore, the high sum concentrations of organophosphorous pesticides in sample sites were mostly found in the source water points of Henan and Shandong provinces, implying that the organophosphorous pesticides may have contaminated the source water sites of Henan and Shandong provinces to some extent.
Analysis of health risks
The deterministic technique was used to examine the carcinogenic and noncarcinogenic risks associated with nitrobenzne compounds, benzene homology, OPPs, and chlorobenzne compounds. The US EPA considers carcinogenic risk values more than 1 in a million (10-6) to be unacceptable [18]. However, depending on national regulations and environmental policies, this permitted threshold could rise to as high as 10-4 [19,20]. Noncarcinogenic hazards with HQ values greater than one suggested the possibility of an undesirable effect or the need for more research. Table 5 shows that the computed HQ values indicated insignificant noncarcinogenic hazards, even though the maximum total HQ value for source water site 4 was nearly four times less than one. According to Table 6, the cancer risk values of benzene and dichlorvos in most source water sites were all less than 1 × 10⁻⁶, with the exception of the cancer risk values of sites 4, 13, 19, 23, 38, and 40, which were all higher than 1 × 10⁻⁶. So, while the majority of the cancer risks caused by benzene and dichlorvos were tolerable, the cancer risks at sites 4, 13, 19, 23, 38, and 40 were unsatisfactory and should be given additional attention [21,22].
Conclusion
The contamination status of benzene homology, chlorobenzene compounds, nitrobenzene compounds, and OPPs (total 17 compounds) in the Huaihe River basin’s major source water was researched, and data on the levels of the 17 compounds in the 51 source water sites was provided. At the same time, the health risk of the target compounds in the fifty-one source water sites for the possible exposed population was assessed using the health risk assessment model (containing cancer risk and noncarcinogenic risk). The levels of the 17 compounds in the fifty-one source water sites were all below the corresponding environmental quality for surface water (chinese) standard limits, and benzene, toluene, ethyl benzene, 2,4-dinitrochlorobenzene, dichlorvos, and demeton were more frequently detected in the fifty-one source water sites, indicating that they were the main organic pollutants in the Huaihe River basin’s source water sites. The noncarcinogenic risk HQ values of the target compounds were less than one, and the cancer risk values of most source water sites were all less than 1 × 10⁻⁶; only the cancer risk values of sites 4, 13, 19, 23, 38, 40 were higher than 1 × 10⁻⁶, indicating that the cancer risks produced by benzene and dichlorvos at sites 4, 13, 19, 23, 38, 40 were at an unacceptable level, and more attention should be paid to them.
Funding
This study was financially supported by the National Key Research and Development Program of China (2019YFD1100205) and the Open Research Fund of State Key Laboratory of Simulation and Regulation of Water Cycle in River Basin, China Institute of Water Resources and Hydropower Research (No.2014QN02).
Acknowledgements
We appreciate Peiren Wu and Haibin Wang’s assistance with the field survey. We would also want to express our gratitude to Dr. Zi-jian Wang and Dr. Qingshan Li for their input on the original manuscript. Furthermore, we would like to express our gratitude to Xiaoqing He and Jinmiao Zha for their invaluable assistance during the research process.
Availability of Data and Materials
The data sets used and/or analyzed during the current study are available from the corresponding author on reasonable request.
Authors’ Contributions
The study’s conception and design were assisted by Gao Jijun and Liu Linhua. Gao jijun, Liu xiaoru, Liu laisheng, and Wang qiwen were in charge of sampling and chemical analyses. Gao jijun and Lao tianying conducted the literature search and analysis. Gao jijun wrote the primary manuscript text, while Gao jijun and Wang qiwen worked on the Tables 1-6 and Figures 1-5 together. Gao jijun, Wang qiwen, and Liu linghua enhanced and critically evaluated the manuscript. All of the contributors provided feedback on prior drafts of the text. The final manuscript was read and approved by all writers.
Conflict of Interest
The authors declare that they have no competing interests.
Competing Interests
The authors declare that they have no competing interests.
References
- Wang L, Ying GG, Zhao JL, Yang XB, Chen F, Tao R, et al. Occurrence and risk assessment of acidic pharmaceuticals in the Huaihe River, Hai River and Liao River of north China. Sci Total Environ. 2010; 408:3139-3147.
[Crossref] [Google scholar] [Pubmed]
- Zhou R, Lv A, Shi J, Jiang G. The levels and distribution of organochlorine pesticides(OCPs) in sediments from the Haihe River, China. Chemosphere. 2005; 61:347-354.
[Crossref] [Google scholar] [Pubmed]
- Liu H, Zhang Q, Wang Y, Cai Z, Jiang G. Occurrence of polychlorinated dibenzo-p-dioxins, dibenzofurans and biphenyls pollution in sediments from the Haihe River and Dagu Drainage River in Tianjin City, China. Chemosphere. 2007; 68:1772-1778.
[Crossref] [Google scholar] [Pubmed]
- Gao J, Liu L, Liu X, Lu J, Zhou H, Huang S, et al. Occurrence and distribution of organochlorine pesticides – lindane, p,p′-DDT, and heptachlor epoxide – in surface water of China. Environ Int. 2008; 34:1097-1103.
[Crossref] [Google scholar] [Pubmed]
- Gao J, Liu L, Liu X, Zhou H, Huang S, Wang Z. Levels and spatial distribution of chlorophenols–2, 4-Dichlorophenol, 2, 4, 6-trichlorophenol, and pentachlorophenol in surface water of China. Chemosphere. 2008; 71: 1181-1187.
[Crossref] [Google scholar] [Pubmed]
- Wang B, Yu G, Yu YJ, Huang J, Hu HY, Wang LS. Health risk assessment of organic pollutants in Jiangsu Reach of the Huaihe River, China. Water Sci Technol. 2009; 59:907-916.
[Crossref] [Google scholar] [Pubmed]
- Liu M, Feng J, Kang B, Chen Y, Liu Q, Sun J. Ecological and health risks of DDTs and HCHs in surface water from the upper reaches of the Huaihe River. Toxicological & Environmental Chemistry. 2015; 97: 1124-1136.
- Liu M, Feng J, Hu P, Tan L, Zhang X, Sun J. Spatial-temporal distributions, sources of polycyclic aromatichydrocarbons (PAHs) in surface water and suspended particularmatter from the upper reach of Huaihe River, China. Ecological Engineering. 2016; 95:143-151.
- U.S EPA. Determination of semivolatile organic chemicals in drinking water by solid phase extraction and capillary column Gas Chromatography/Mass Spectrometry (GC/MS). Environmental Protection Agency, Washing-ton DC, USA. 1995.
- Zhou JL, Hong HS, Zhang ZL, Maskaoui K, Chen WQ. Multi-phase distribution of organic micropollutants in Xiamen Harbour, China. Water Res. 2002; 34: 2132-2150.
- Zhang ZL, Hong HS, Zhou JL, Yu G, Chen WQ, Wang XH. Transport and fate of organochlorine pesticides in River Wuchuan, Southeast China. J Environ Monitor. 2002; 4:435-441.
[Crossref] [Google scholar] [Pubmed]
- Zhang ZL, Dai MH, Hong HS, Zhou JL, Yu G. Dissolved insecticides and polychlorinated biphenyls in the Pearl River Estuary and South China Sea. J Environ Monitor. 2002; 4:922-928.
[Crossref] [Google scholar] [Pubmed]
- U.S EPA. Guideline for carcinogen risk assessment. Risk Assessment Forum. U.S. Environmental Protection Agency, Washing-ton DC, USA. 1999.
- U.S EPA. Guidelines for exposure assessment. Risk Assessment Forum. U.S. Environmental Protection Agency, Washing-ton DC, USA. 1992.
- Patrick DR. Risk assessment and risk management. In: Toxic Air Pollution Handbook, VanNostrand Reinhold, New York. 1994; 347.
- U.S EPA. Guidance for performing aggregate exposure and risk assessments. U.S. Environmental Protection Agency, Washing-ton DC, USA. 1999.
- IRIS. Integrated Risk Information System. US Environmental Protection Agency. 2021.
- U.S EPA. Revisions to the methodology for deriving ambient water quality criteria for the protection of human health. 2000.
- World Health Organization. Guideline for drinking-water quality. WHO, Geneva, Switzerland. 2004.
- U.S EPA. Water quality standards; Establishment of numeric criteria for priority toxic pollutants for the State of California. 2000.
- Ding H, Li XG, Sun YC, Shao XL, Shen WR. The discussion about organic material pollutions in main stream of the Haihe river. Haihe Water Resources. 2005; 2:18-20.
- Gao Jijun, Liu Linghua, Liu Xiaoru, Lu Jin, Hao Hong, Yuan Hao, et al. The organic contamination survey and health risk assessment of 16 source water reservoirs in Haihe River basin. Water Science & Technology, 2012; 65: 998-1006.
[Crossref] [Google scholar] [Pubmed]
Copyright: © 2022 The Authors. This is an open access article under the terms of the Creative Commons Attribution NonCommercial ShareAlike 4.0 (https://creativecommons.org/licenses/by-nc-sa/4.0/). This is an open access article distributed under the terms of the Creative Commons Attribution License, which permits unrestricted use, distribution, and reproduction in any medium, provided the original work is properly cited.